The Python code for this project can be found here.
Introduction
The following is a continuation of my work on my first DataCamp Competition, The Vault of Classics. My first post covered all of my data cleaning. This post will show my results.
In case you have forgotten, my goals were to
- visualize how each genre’s popularity changed over time.
- determine the most powerful publishers and examine how their market share changed over time.
- identify the most beloved games and the most beloved game series.
Genre Popularity
I began my data analysis with goal of following genres through the years to identify the most popular. I quickly realized that this presented two problems.
Because video game sales increased, and quite a bit, through 2009, most genres would increase in popularity through 2009. No genre ever fell out of the race completely, though strategy didn’t appear until the 1990s. This difficulty was solved by comparing each genre’s market share rather than its absolute sales.
Additionally, mapping twelve genres over every year would look messy and include plenty of ups and downs hiding the trends. Instead I grouped sales by decade.
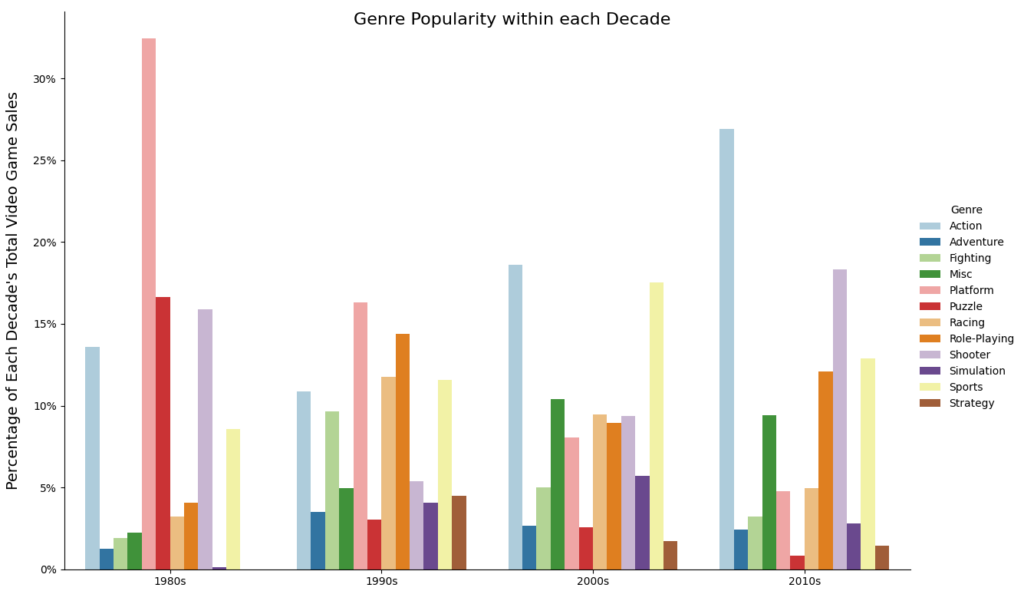
It is clear that the original powerhouse, platform games like Super Mario Bros., steadily decreased over time. Shooter games, such as Call of Duty, and action games, like Grand Theft Auto, made a comeback in the 2000s after a dip in the 1990s. Sports games, including Wii Sports and FIFA, maintained a strong market position throughout the years studied. Interestingly, puzzle games market share fell sharply after their introduction in the 1980s. In more recent years, puzzle games have become the purview of cell phones, a platform untouched by this dataset.
The Most Powerful Publishers
One of the original goals of the DataCamp Competition was to identify the most popular teams, but no clear definition of “team” was ever provided. Based on the dataset, I interpreted “teams” as publishers. As I found in my data clean up, publisher data is messy. Different publishers created the same game for different platforms. Publishers bought other publishers. Parent companies closed and their subsidiaries became the new publishing giants. An entire study could be devoted to the growing and sloughing off of various publishers and creative teams.
In the end, I decided to select publishers grossing more than $350 million in sales over the years 1980 to 2016. Adding even a few additional publishers made the following chart unreadable. Fewer than six did not represent enough of the market. (The runners up, grossing between $200 million and $350 million descending, are THQ , Konami Digital Entertainment , Namco Bandai Games , Microsoft Game Studios , and Capcom.)
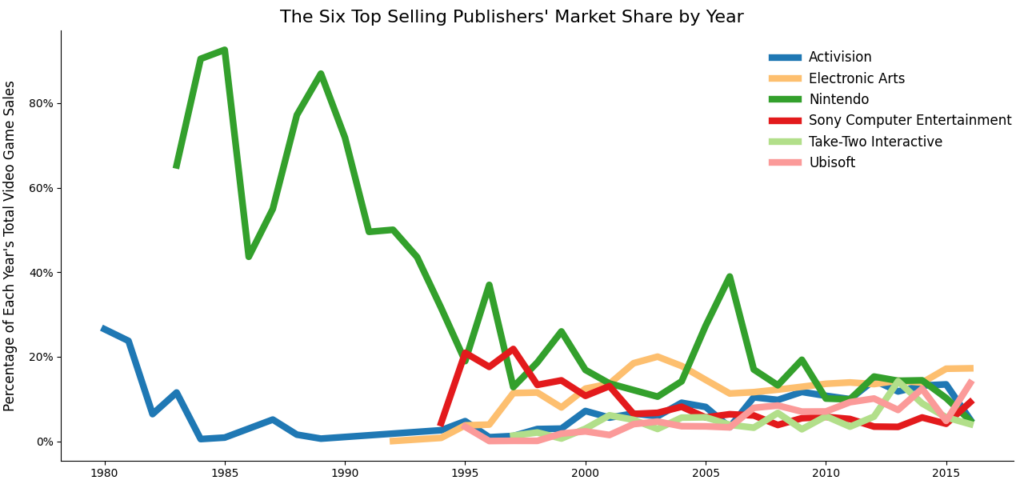
In early years, Nintendo and Activision shared the market only with those publishers that would not perform as well into the next millennium. In this way, the readability of the chart sacrifices a bigger story. However, we can zoom in on the publishers winning the race in the early years.
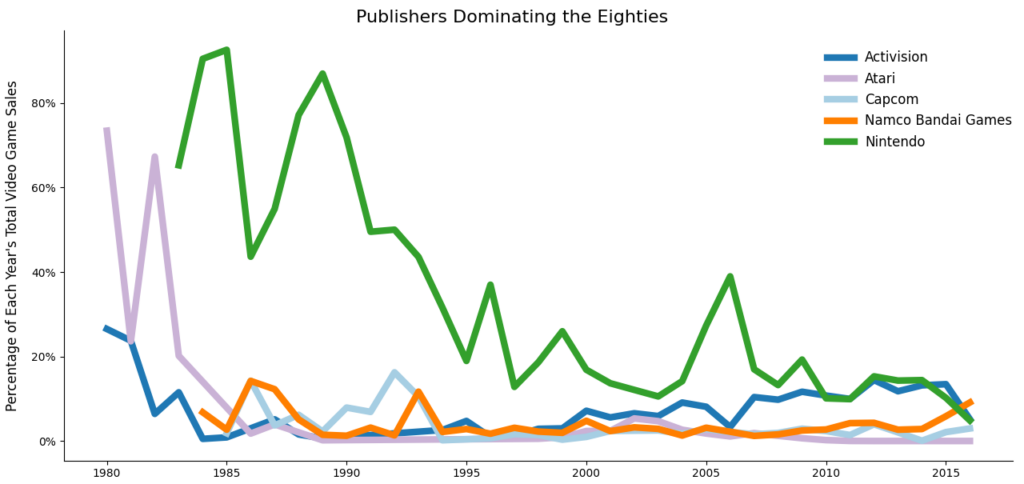
Here we still see long time leaders Nintendo and Activision, but we also see fallen hero Atari alongside the retreating Capcom and Namco Bandai Games.
To get a better look at the total sales of each of the top six publishers over time, I produced a stacked bar chart.
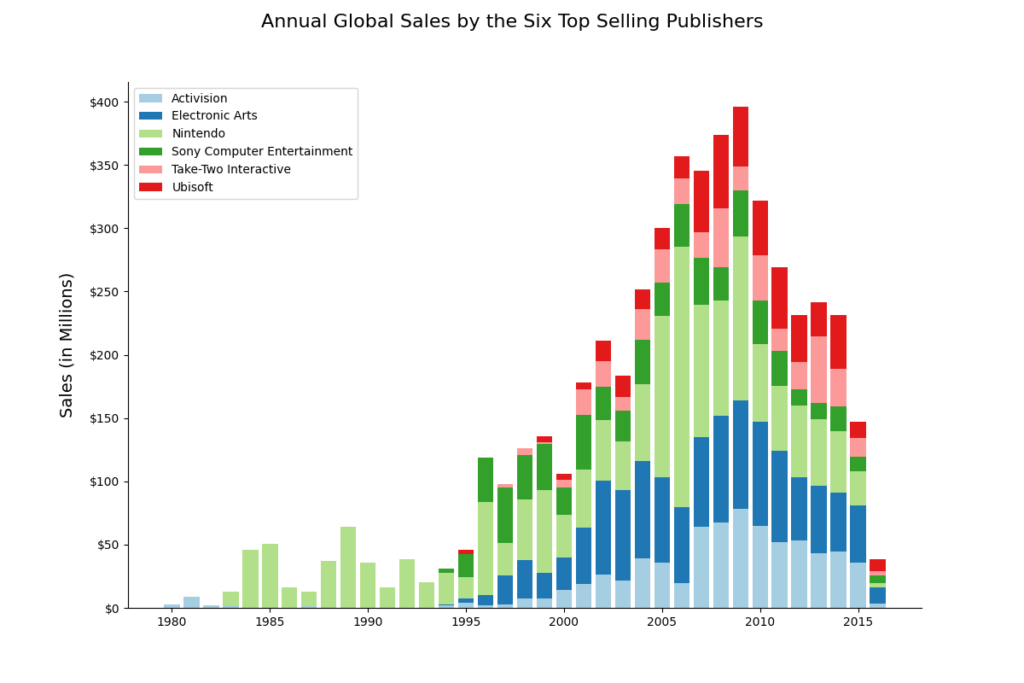
Nintendo’s dominance throughout the early 2000s is evident. As time progressed, the strong players shared the market more equally.
Let’s drill down a bit. Which games are driving the success of each of these top six publishers? I decided to look at just the top 15% of each publisher’s sales and see which of their games were the best selling.
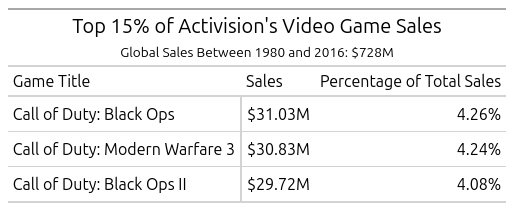
Not surprisingly, Call of Duty is responsible for a third of Activision’s revenues. (It would be interesting to see advertising costs for these bestselling games.)
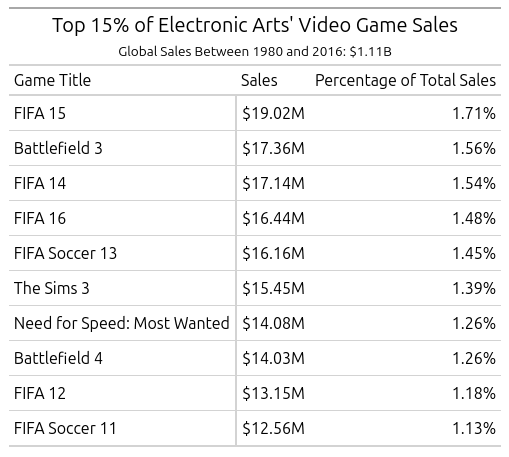
As an American, it was surprising to me to see FIFA leading Electronic Arts. A similar query looking solely at North American sales shows that Madden holds sway here. Madden’s top selling year is 2007 and it doesn’t come close to selling like FIFA, only grossing $10 million globally.
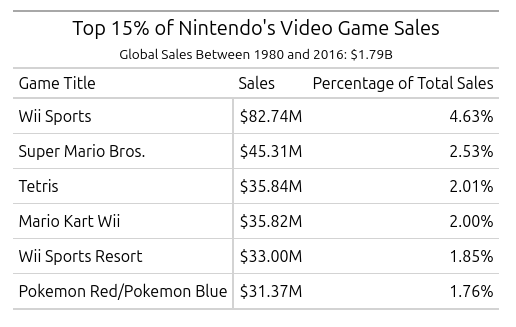
Nintendo is an absolute powerhouse. (These tables give you a hint of the best selling game visualizations coming soon.) As a non-gamer, I have played five of the seven games in this list (and none of the titles from other publishers.)
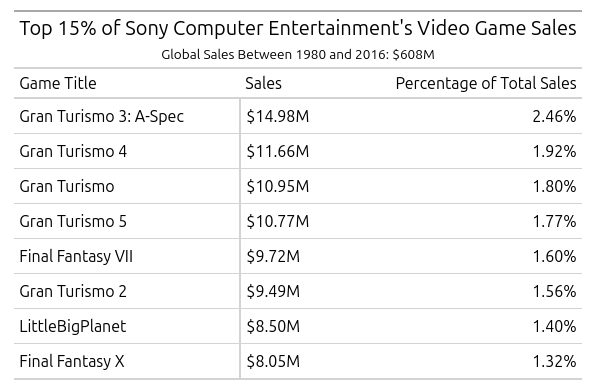
Prior to this data project, I had never heard of Gran Turismo. However, North American sales of Gran Turismo 3: A-Spec make up nearly half of total sales at $6.85 million.
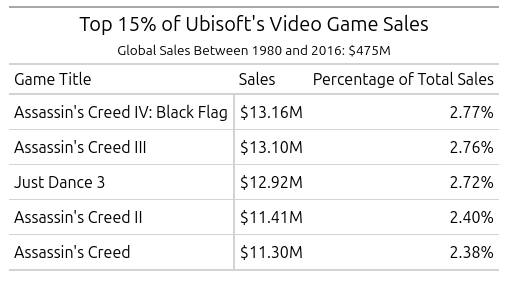
Although I have heard of Assassin’s Creed, I am more familiar with Ubisoft’s Rainbow Six Siege because my son plays it–frequently. Interestingly, Rainbow Six Siege accounts for $16.1 million in this dataset and first appeared in 2001. Assassin’s Creed accounts for $83.9 million and first appeared in 2007.
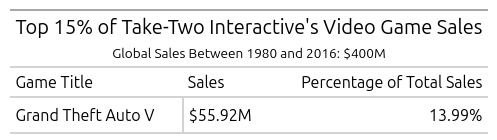
All of the Grand Theft Auto games in this dataset make up nearly 40% of Take-Two’s total sales.
Favorite Games
Before I moved forward to the best selling games in the world, I wanted to look for games that were top sellers regionally, but overlooked by the rest of the world.
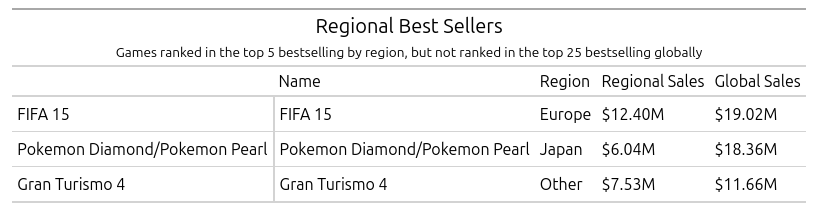
In spite of Electronic Arts’ and Sony’s huge presence in world video game sales, none of their individual games made it to the top 25 globally. They did make appearances in top regional sales with FIFA 15 and Gran Turismo 4. Of course, the omnipresent Nintendo appears among both the top 25 games worldwide and the regional favorites from Japan.
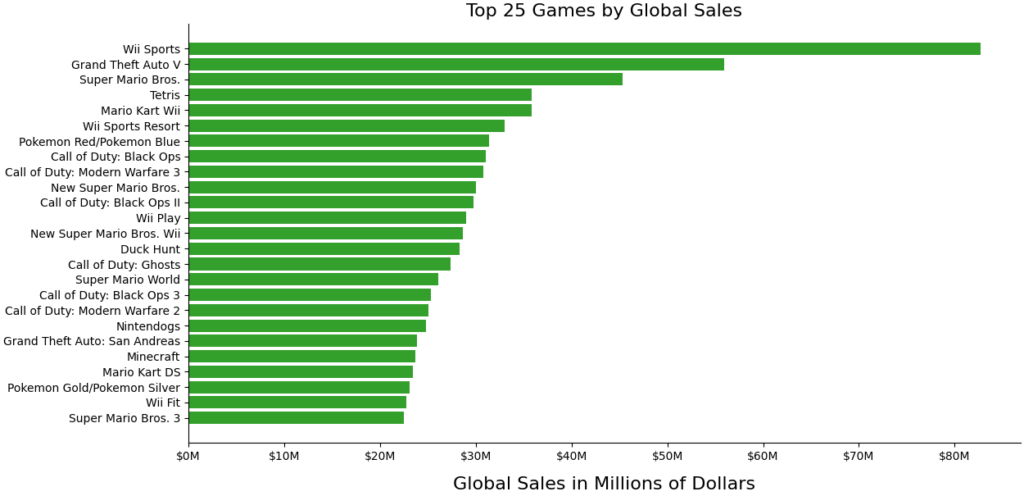
I find it amazing that certain series titles appear multiple times in the top 25 best selling games. I wanted to see which game series would beat out the others if titles were grouped into these series. Using Python’s string methods, I removed numbers and roman numerals from the right of each title. Then, I split at any colons and kept only the string appearing before the colon. Then I removed more numbers. Finally, I removed the word “New” and stripped the leading and trailing white space.
Next, I used elif statements to group together all titles containing the string “Pokemon.” I did the same with “Super Mario”, “FIFA”, and “Wii Sports.” The result was a slightly different view of the top selling games by series title.
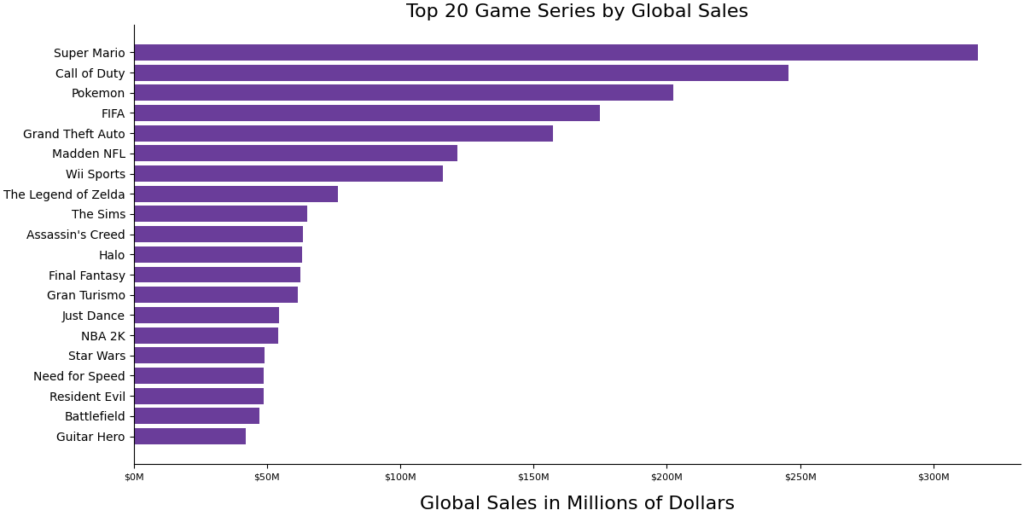
Some familiar names, like Super Mario; Call of Duty; Pokemon; and FIFA, appear in this list like Super Mario, Call of Duty, Pokemon and FIFA. There are also some new names like Madden NFL, Legend of Zelda, The Sims, and Halo that have gained rank.
Final Conclusions
We can see the presence of the Action, Shooter, and Sports genres in our collection of top games and game series. The shadow of the platform genre looms large in the incredible sales of Nintendo’s Super Mario series.
Those same six publishers have dominated the video game market’s sales for 30 or more years.
It would be fascinating to see what an updated dataset would reveal. How do the games tracked in this project compare with Roblox, Fortnite, and Minecraft? I would love to see how games sales are correlated with maturity rating also, although some of these games are too old to have ratings. In all, this was a fun dataset to manipulate and study. Now, I may just have to spend the $7.99 to download Mario Arcade to my Nintendo Switch…you can add that to Super Mario’s sales totals!
The Python code for this project can be found here.